The focus of today's post is two-fold. First, to update the reported cases for each of the five states. Second, to examine the demographic distributions of the positive cases, across each of the states. As of this writing, the global total exceeds 775K and the US is just under 160K. I will not add another state today, since the focus is on the demographics of the cases. Additional states will be included tomorrow.
First, an update on the data for the five states. I did not update the data over the weekend; in Figure 1 you can see how the total number of positive cases in each state has changed since the last post on 3/27/30. Unfortunately, in the past 24 hours, both Maryland and Iowa reported an outbreak in a nursing home. Today's totals in those two states reflect those outbreaks.
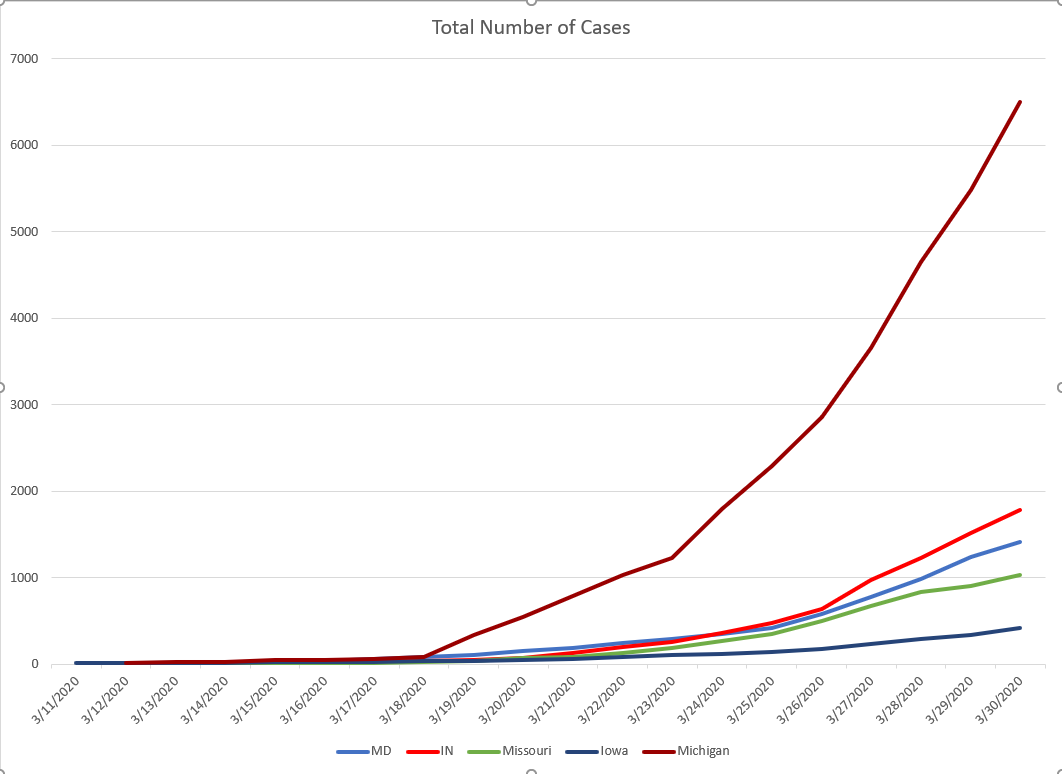 |
| Figure 1. Total Positive Cases of COVID in Five States, over Time |
As the trends continue in all five states, the next aspect to examine (for the first time here) is focused on the testing. All five of the states now report the total number of tests. Figure 2 and Figure 3, taken together, demonstrate the scope of testing across each state. Michigan has tested more people than any of the other four states, but also has the highest percentage of positives, as well as the highest number of cases. In other words, similar to how experts are describing New York, Michigan most likely had community spread long before the testing began in the state. Missouri on the other hand, is testing at a high volume and has one of the lowest percentage of positive cases. Missouri is the best case of the five states when it comes to testing. As more tests become available, the percent positive will decrease even as the cases continue to rise exponentially.
 |
| Figure 2. Total Number of COVID Tests in Five States |
 |
| Figure 3. Percentage of Positive Cases in Five States |
The age of people infected with COVID has been a focus since the start of the pandemic. It was reported early that the disease impacted older adults. Four of the states are represented below in the four pie graphs (see Figure 4) . Iowa is not included here because the state is reporting cases in 20 year age increments, while the other 4 states are reporting positive cases in each decade of age. In reality, Iowa's data follows the same trend. However, keeping the visual to these four states illustrates the consistency. If the ages are difficult to read on the screen, the lighter blue wedge at the top (12:00) is 10-19, and each decade thereafter is around the pie, clockwise. Maryland has reported 5 cases in children ages 0-9. Those numbers are included in Maryland's 10-19 wedge. Overall, there are some differences in percentages across the states, but the trends are fairly consistent. Anyone can contract the virus.
 |
| Figure 4. Positive Cases by Age Range in Four States |
Finally, a note on mortality. The percentage of people dying from COVID compared to the number of cases in each state is fairly consistent [range 1.06% : 2.83%]. Maryland had the lowest mortality rate (1.06%), followed by Missouri (1.26%), Iowa (1.42%), Indiana (2.18%), and Michigan (2.83%). Currently, only Indiana has reported an age distribution of the deceased. Indiana and Michigan are both reporting the gender distribution of individuals who have died due to COVID. In both states, the gender distribution of positive case is fairly even (IN: 52% male, 48% female; MI: 49% male, 51% female). This is also the case in the other three states. However, the mortality gender percentages are significantly different in the two states currently reporting this data. In Indiana, 65.6% of the people who have died due to COVID are male, 68% are male in Michigan. Once more states begin to report the demographics of the deceased, this will be further analyzed. However, the evidence right now suggests that males and females contract the disease in similar proportions, but the disease is twice as likely to be fatal in men. Again, these numbers are early and could very well change.
As always, stay home, stay healthy, stay safe.
JRB
No comments:
Post a Comment