After yesterday's post, it was announced that the United States now has more cases than any other country worldwide. The purpose of this blog is to look at the publicly available data in different ways. My aim is to increase awareness beyond the state and national totals. This is important because only when we have a reference point are we able to evaluate how our own state is responding to the pandemic. This leads me to the purpose of today's post. I am going to update the totals from the five states already included. Then, I will plot some points where decisions were made in each state. Finally, since my background is in mental health, I will devote a moment to that as well.
As a disclaimer, the data provided here is only as good as the testing. Most states are only testing people with significant symptoms, given the national shortage of test kits and/or materials/reagents require to completed the tests. The real number of U.S. cases will never be known. However, examining the data we do have is still critical.
First, the totals of the first four states (Figure 1) demonstrate Indiana's accelerated growth and Iowa's continued gradual growth. If this trend continues, Iowa will be a case study for how to flatten the curve. On March 14th Indiana had the second fewest cases of these four states, behind Missouri. In other words, Indiana had fewer cases than Iowa on March 14th.
 |
| Figure 1. Total COVID Case for Four States |
When the Michigan data is included (see Figure 2), it is difficult to see the trends in the other four states, which is why only the first four states are the focus of Figure 1. Today, Michigan's cases increased by 28%, which is actually the smallest daily percentage increase of the five states [range 28%:52%].
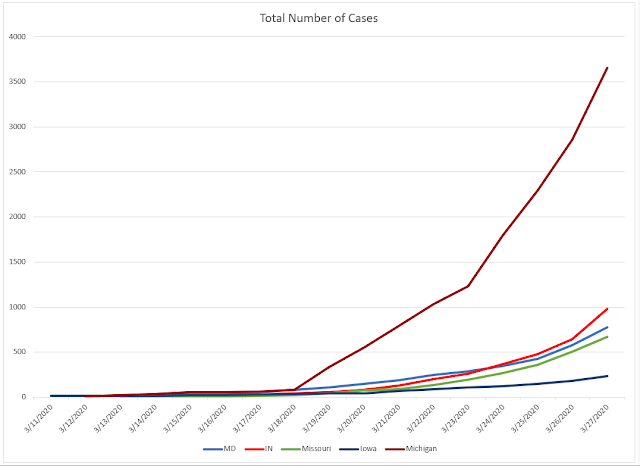 |
| Figure 2. Total COVID Cases for Five States |
Finally, as I have included on previous days, it is important to have a standard starting point when attempting to compare states. The starting point in this analysis is the day each state announced at least 15 cases. For those specific dates, please see yesterday's entry.
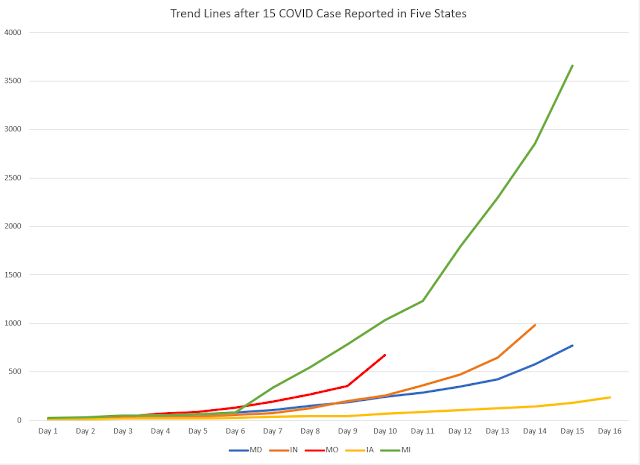 |
| Figure 3. Growth trend of COVID Cases for Five States after 15 Cases Reported |
Figure 3 demonstrates that although Missouri has fewer cases than Indiana or Maryland, the growth of the cases in Missouri is happening at a faster rate. Understanding this piece of data is key to understanding why it is not reasonable to compare total cases in the US to total cases in China or Italy. We are several weeks behind each of those countries. Yet, our cases as of 3/26/20 were the highest in the globe. Meaning, our growth rate is higher in the US. It is also important to remember that this is why one cannot compare the number of moralities in the US to the numbers in China, Italy, or Spain. Again, we are behind all those countries when it comes to a standard starting point.
The added information for today is examining when each state implemented specific policies. Figure 3 is the graph we will use to compare when policies were implemented in the five states. In Figure 4, the two policies included are the state-wide closure of schools and state-wide stay-at-home order.
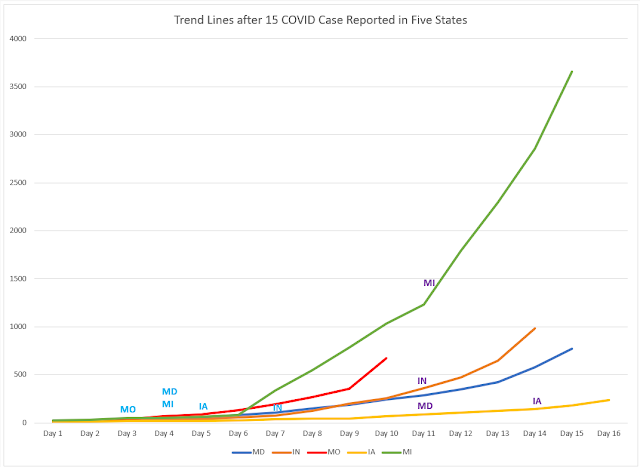 |
| Figure 4. State-Wide Closure of Schools and Stay-at-Home Orders for Five States |
Most of the schools in the nation (labels in BLUE) closed around the same time. As a reminder, this graph shows the date of closures after each state announced at least 15 cases in the state. Differences do exist between states regarding stay-at-home orders (labels in PURPLE). At the time of publication, Missouri had not yet issued a stay-at-home order. There are significant policy difference between states. These two policies were selected because they are two of the most consistently implemented policies. Interestingly, most bars and restaurants were closed in conjunction with the closure of schools in each state. Once more states declare states of emergency, those points will be included. The closure of all non-essential businesses and stay-at-home orders are a critical point in containing the spread. When each state enacted these two orders will most likely be related to the total number of cases once we come out on the other side.
As I mentioned at the start, I want to take a moment to address mental health during this time. It is very easy to become overwhelmed with all the information. It is normal to feel overwhelmed and anxious. Please focus on your self care. In times of high anxiety regaining a sense of control can be helpful. Oftentimes, volunteering gives that sense of control. I know in Maryland, the governor launched a Maryland Unites website to connect people with volunteering opportunities. Other states have most likely done something similar. That is exactly how I found myself delivering for Meals on Wheels this week. As someone who is in a helping profession, volunteering is a piece of my self care. Everyone's self care will look different: read a book, crochet or knit, exercise, work in your garage for hours. Regardless of what you do, you cannot help others unless you are taking care of yourself.
Stay home, Stay healthy, Stay safe. JRB


Good stuff Jen!
ReplyDeleteJust an FYI...
IA currently does not have a Stay-at-Home or Shelter-in-Place order.
Just have urged people to do so and to stick to actual social distancing.
They have closed all non-essential businesses which expanded to clothing, shoes, bookstores, etc. today.
https://coronavirus.iowa.gov/
Hmmmm. I saw something posted 2 days ago that mentioned it. I'll need to go back and look. Thanks for keeping me accountable!
DeleteIs there anything out there that breaks down the demographics of those dying from this disease?
ReplyDeleteYes, states are starting to release age and gender demographics. I'm working to include those next time.
DeleteThis comment has been removed by the author.
DeleteI misread your question - the age and gender demographics are for confirmed cases. The COVID deaths are not disaggregated by demographics, at this time.
Delete